Bug Reporting: How you can help us finding the cause for technical issues
You noticed something is not working as expected regarding the doo Event Manager or the online booking process and you think it’s a technical issue (“Bug”)?
1. Excluding individual, browser-based issues
To rule out browser-specific settings as a cause for the issue so it is no general problem of the software, please follow these steps:
1.1. Clear the browser-Cache. This is possible in the browser-settings – the precise way depends on the type and version of your browser. Please search online for a step-by-step-manual if your in doubt how to proceed.
1.2. If possible open the website in another browser or another device and check, if the issue does also occure.
If the issue occurs in both cases, please report this issue to our Support-Team as described in the following .
2. Reporting an Issue (“Bug Report”)
For reproducing and handing over the problem to our engineers, our team needs a pretty precise description of the issue. Please answer the following questions if you have a report:
- With which ID are you logged in by doo (is displayed on the right above in your doo Event Manager) and which URL did you call up?
- Which steps did you do until you came across the problem? What exactly was your goal? Is an error-notification displayed? If so, please send us a screenshot.
- Which device (Computer, tablet, smartphone?), which browser and which version of the browser are you using? Are there any Add-Ons installed in the browser?
Please send these information via Email to our Support-Team. The more exact you describe the issue at the beginning, the better and faster we can comprehend the issue, which makes a fast solution more likely.
3. On demand: Additional information from the developer console
If we can not reproduce your problem or if it’s pretty complex, our Support-Team possibly needs the information, which is recorded by your browser when the issue occurs, so we get more hints for the cause of the problem. In these cases our Support-Team asks you, to send us more details from the developer concole (“Developer Tools”), which you can call up by your browser.
3.1. Opening the developer console
Open a new tab in your browser and show the developer console. The shortcut for opening the developer tools depends on your browser – usually you only have to click right anywhere on the site and choose “Element-information”, “Investigate site” or something similar. As an alternativ you can open the developer console in the browser settings. Please search online for a step-by-step-manual if your in doubt how to proceed.
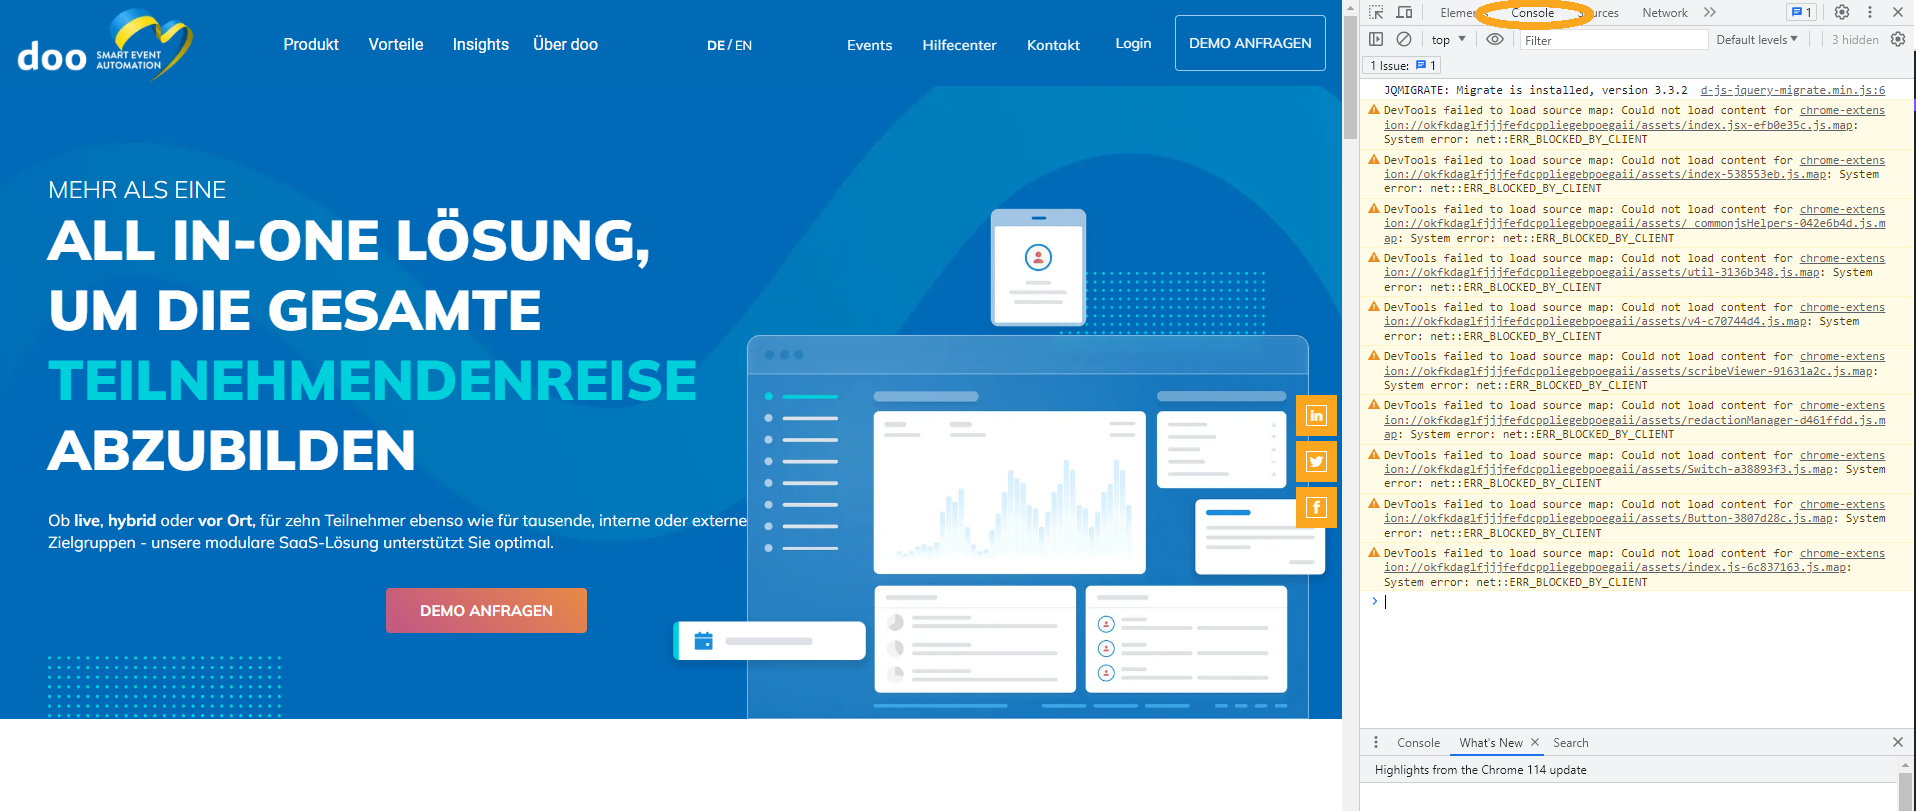
The console is then displayed in your browser window as sidebar next to or below the website. Please open the Network-Tab in the console.
3.2. Reproducing incorrect display
Please carry out exactly the same steps, which led to the incorrect display while having the developer console opened. Each step automatically generates entries in the console.
Depending on the type of the problem, we either need a screenshot of the opened developer console or a HAR-file, which includes all records of your browser for this site.
3.3. Screenshot of the developer console
Please make a screenshot from the whole screen, where the opened website and also the entries of the Network-Tab of the developer console can be recognized.
Then send the screenshot to the Support-Team via email.
3.4. Creating a HAR-file
If our Support-Team asked you to send a Har-file, search a download or saving symbol in the taskbar of the Network-Tab and start the export.
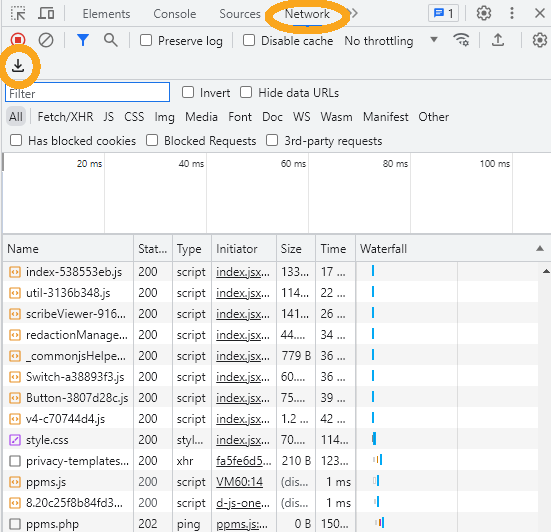
As alternative you can click right in the column “Name” and choose “Saving as HAR-file”. If these descriptions aren’t correct for your browser , please search online with the keywords “HAR-file” and your browser version for a step-by-step-manual.
After downloading the file, please send it to our Support-Team.